spatialLIBD

Lifecycle: stable Bioc release status Bioc devel status Bioc downloads rank Bioc support Bioc last commit Bioc dependencies Codecov test coverage R build status GitHub issues DOI

Welcome to the spatialLIBD project! It is composed of:

The web application allows you to browse the LIBD human dorsolateral pre-frontal cortex (DLPFC) spatial transcriptomics data generated with the 10x Genomics Visium platform. Through the R/Bioconductor package you can also download the data as well as visualize your own datasets using this web application. Please check the manuscript or bioRxiv pre-print for more details about this project.

If you tweet about this website, the data or the R package please use the #spatialLIBD hashtag. You can find previous tweets that way as shown here. Thank you!

Study design

As a quick overview, the data presented here is from portion of the DLPFC that spans six neuronal layers plus white matter (A) for a total of three subjects with two pairs of spatially adjacent replicates (B). Each dissection of DLPFC was designed to span all six layers plus white matter (C). Using this web application you can explore the expression of known genes such as SNAP25 (D, a neuronal gene), MOBP (E, an oligodendrocyte gene), and known layer markers from mouse studies such as PCP4 (F, a known layer 5 marker gene).

This web application was built such that we could annotate the spots to layers as you can see under the spot-level data tab. Once we annotated each spot to a layer, we compressed the information by a pseudo-bulking approach into layer-level data. We then analyzed the expression through a set of models whose results you can also explore through this web application. Finally, you can upload your own gene sets of interest as well as layer enrichment statistics and compare them with our LIBD Human DLPFC Visium dataset.

If you are interested in running this web application locally, you can do so thanks to the spatialLIBD R/Bioconductor package that powers this web application as shown below.

## Run this web application locally
spatialLIBD::run_app()

## You will have more control about the length of the
## session and memory usage.

## You could also use this function to visualize your
## own data given some requirements described
## in detail in the package vignette documentation
## at http://research.libd.org/spatialLIBD/.

Shiny website mirrors

R/Bioconductor package

The spatialLIBD package contains functions for:

  • Accessing the spatial transcriptomics data from the LIBD Human Pilot project (code on GitHub) generated with the Visium platform from 10x Genomics. The data is retrieved from Bioconductor’s ExperimentHub.
  • Visualizing the spot-level spatial gene expression data and clusters.
  • Inspecting the data interactively either on your computer or through spatial.libd.org/spatialLIBD/.

For more details, please check the documentation website or the Bioconductor package landing page here.

Installation instructions

Get the latest stable R release from CRAN. Then install spatialLIBD from Bioconductor using the following code:

if (!requireNamespace("BiocManager", quietly = TRUE)) {
    install.packages("BiocManager")
}

BiocManager::install("spatialLIBD")

If you want to use the development version of spatialLIBD, you will need to use the R version corresponding to the current Bioconductor-devel branch as described in more detail on the Bioconductor website. Then you can install spatialLIBD from GitHub using the following command.

BiocManager::install("LieberInstitute/spatialLIBD")

Access the data

Through the spatialLIBD package you can access the processed data in it’s final R format. However, we also provide a table of links so you can download the raw data we received from 10x Genomics.

Processed data

Using spatialLIBD you can access the Human DLPFC spatial transcriptomics data from the 10x Genomics Visium platform. For example, this is the code you can use to access the layer-level data. For more details, check the help file for fetch_data().

## Load the package
library("spatialLIBD")

## Download the spot-level data
spe <- fetch_data(type = "spe")

## This is a SpatialExperiment object
spe
#> class: SpatialExperiment 
#> dim: 33538 47681 
#> metadata(0):
#> assays(2): counts logcounts
#> rownames(33538): ENSG00000243485 ENSG00000237613 ... ENSG00000277475
#>   ENSG00000268674
#> rowData names(9): source type ... gene_search is_top_hvg
#> colnames(47681): AAACAACGAATAGTTC-1 AAACAAGTATCTCCCA-1 ...
#>   TTGTTTCCATACAACT-1 TTGTTTGTGTAAATTC-1
#> colData names(66): sample_id Cluster ... spatialLIBD ManualAnnotation
#> reducedDimNames(6): PCA TSNE_perplexity50 ... TSNE_perplexity80
#>   UMAP_neighbors15
#> mainExpName: NULL
#> altExpNames(0):
#> spatialData names(3) : in_tissue array_row array_col
#> spatialCoords names(2) : pxl_col_in_fullres pxl_row_in_fullres
#> imgData names(4): sample_id image_id data scaleFactor

## Note the memory size
lobstr::obj_size(spe) 
#> 2.04 GB

## Remake the logo image with histology information
vis_clus(
    spe = spe,
    clustervar = "spatialLIBD",
    sampleid = "151673",
    colors = libd_layer_colors,
    ... = " DLPFC Human Brain Layers\nMade with research.libd.org/spatialLIBD/"
)

Raw data

You can access all the raw data through Globus (jhpce#HumanPilot10x). Furthermore, below you can find the links to the raw data we received from 10x Genomics.

SampleID h5_filtered h5_raw image_full image_hi image_lo loupe HTML_report
151507 AWS AWS AWS AWS AWS AWS GitHub
151508 AWS AWS AWS AWS AWS AWS GitHub
151509 AWS AWS AWS AWS AWS AWS GitHub
151510 AWS AWS AWS AWS AWS AWS GitHub
151669 AWS AWS AWS AWS AWS AWS GitHub
151670 AWS AWS AWS AWS AWS AWS GitHub
151671 AWS AWS AWS AWS AWS AWS GitHub
151672 AWS AWS AWS AWS AWS AWS GitHub
151673 AWS AWS AWS AWS AWS AWS GitHub
151674 AWS AWS AWS AWS AWS AWS GitHub
151675 AWS AWS AWS AWS AWS AWS GitHub
151676 AWS AWS AWS AWS AWS AWS GitHub

Citation

Below is the citation output from using citation('spatialLIBD') in R. Please run this yourself to check for any updates on how to cite spatialLIBD.

print(citation("spatialLIBD"), bibtex = TRUE)
#> 
#> Pardo B, Spangler A, Weber LM, Hicks SC, Jaffe AE, Martinowich K,
#> Maynard KR, Collado-Torres L (2022). "spatialLIBD: an R/Bioconductor
#> package to visualize spatially-resolved transcriptomics data."
#> _BMC Genomics_. doi: 10.1186/s12864-022-08601-w (URL:
#> https://doi.org/10.1186/s12864-022-08601-w), <URL:
#> https://doi.org/10.1186/s12864-022-08601-w>.
#> 
#> A BibTeX entry for LaTeX users is
#> 
#>   @Article{,
#>     title = {spatialLIBD: an R/Bioconductor package to visualize spatially-resolved transcriptomics data},
#>     author = {Brenda Pardo and Abby Spangler and Lukas M. Weber and Stephanie C. Hicks and Andrew E. Jaffe and Keri Martinowich and Kristen R. Maynard and Leonardo Collado-Torres},
#>     year = {2022},
#>     journal = {BMC Genomics},
#>     doi = {10.1186/s12864-022-08601-w},
#>     url = {https://doi.org/10.1186/s12864-022-08601-w},
#>   }
#> 
#> Maynard KR, Collado-Torres L, Weber LM, Uytingco C, Barry BK, Williams
#> SR, II JLC, Tran MN, Besich Z, Tippani M, Chew J, Yin Y, Kleinman JE,
#> Hyde TM, Rao N, Hicks SC, Martinowich K, Jaffe AE (2021).
#> "Transcriptome-scale spatial gene expression in the human dorsolateral
#> prefrontal cortex." _Nature Neuroscience_. doi:
#> 10.1038/s41593-020-00787-0 (URL:
#> https://doi.org/10.1038/s41593-020-00787-0), <URL:
#> https://www.nature.com/articles/s41593-020-00787-0>.
#> 
#> A BibTeX entry for LaTeX users is
#> 
#>   @Article{,
#>     title = {Transcriptome-scale spatial gene expression in the human dorsolateral prefrontal cortex},
#>     author = {Kristen R. Maynard and Leonardo Collado-Torres and Lukas M. Weber and Cedric Uytingco and Brianna K. Barry and Stephen R. Williams and Joseph L. Catallini II and Matthew N. Tran and Zachary Besich and Madhavi Tippani and Jennifer Chew and Yifeng Yin and Joel E. Kleinman and Thomas M. Hyde and Nikhil Rao and Stephanie C. Hicks and Keri Martinowich and Andrew E. Jaffe},
#>     year = {2021},
#>     journal = {Nature Neuroscience},
#>     doi = {10.1038/s41593-020-00787-0},
#>     url = {https://www.nature.com/articles/s41593-020-00787-0},
#>   }

Please note that the spatialLIBD was only made possible thanks to many other R and bioinformatics software authors, which are cited either in the vignettes and/or the paper(s) describing this package.


Basic information overview about the spot-level SingleCellExperiment object. You can download it using spatialLIBD::fetch_data(type = "spe").


                  When this information has been displayed it means that the shiny web application has finished loading and you can start exploring the rest of it.
                  

Spot-level spatialLIBD documentation

This document describes the spot-level portion of the shiny web application made by the spatialLIBD Bioconductor package. You can either find the documentation about this package through Bioconductor or at the spatialLIBD documentation website. Below we explain the options common across tabs and each of the tabs at the spot-level data.

Slides and videos

You might find the following slides useful for understanding the features from this part of the web application.

These slides were part of our 2021-04-27 webinar for BioTuring that you can watch from their website or YouTube:

A recording of an earlier version of this talk is also available on YouTube.

You might also be interested in this video demonstration of spatialLIBD for the LIBD rstats club.

Raw summary

Before the documentation, this tab displays the SpatialExperiment object that contains the spot-level data. It’s basically useful to know that the data has been loaded and that you can start navigating the app. If you wish to download this data, use the following command.

## Download spe data
spe <- spatialLIBD::fetch_data(type = 'spe')

Throughout the rest of this document, we’ll refer to this object by the name spe.

Common options

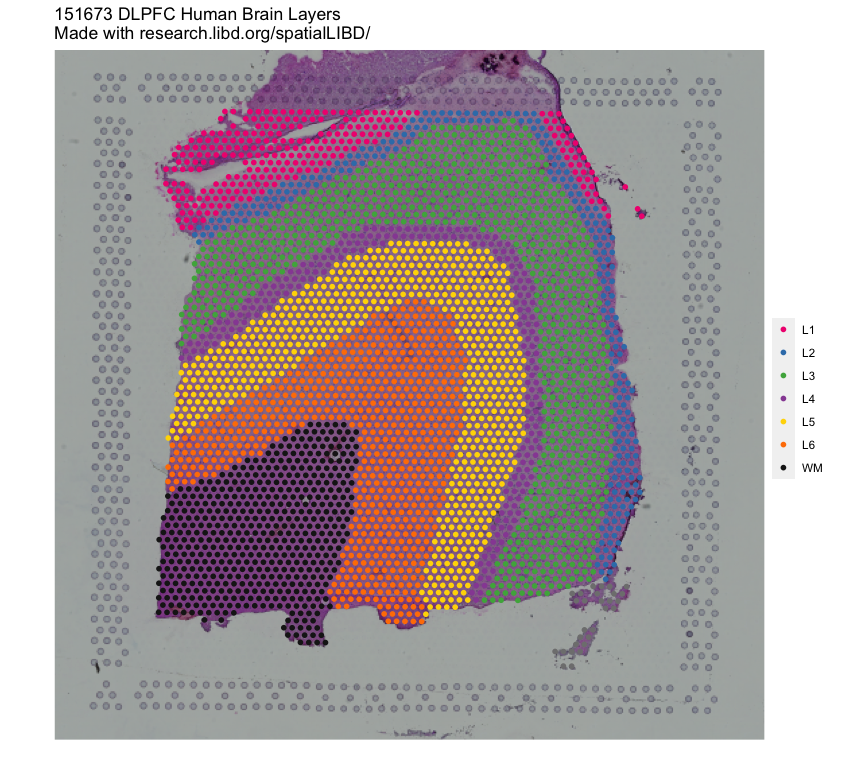
  • Samples to plot: which sample to plot on the tabs that do not have grid on their name.
  • Discrete variable to plot: which discrete variable (typically with the cluster labels) to visualize. We include the clusters:
    • the official manual annotation used extensively in our pilot study (DOI: 10.1038/s41593-020-00787-0)
    • from the graph based clustering results produced by spaceranger one Visium slide at a time. These clusters are saved as GraphBased.
    • from your own manual annotation of the spots under ManualAnnotation.
    • resulting the manual annotation by Kristen R Maynard and Keri Martinowich using known markers and histology features. This was an initial exploration and was not analyzed in more detail.
    • resulting from using a shared nearest neighbors approach with 50 neighbors cut at 4 up to 28 clusters. These are SNN_k50_k4 up to SNN_k50_k28.
    • described in Figure 7 from our paper (DOI: 10.1038/s41593-020-00787-0) such as SpatialDE_PCA, SpatialDE_pool_PCA and others.
  • Reduced dimensions: which reduced dimension to visualize on the clusters (interactive) tab. Only the first two dimensions will be shown.
  • Continuous variable to plot: which gene or continuous variable (such as the cell count, the ratio of the mitochondrial chromosome expression) to visualize in the gene tabs as well as on the clusters (interactive) tab.
  • Gene scale: whether to use the raw expression values (counts) or the scaled and log transformed values (logcounts).
  • Image name: the name of the background image to use. You can edit this image on the Edit image tab.
  • Spot transparency level: the transparency of the spots in the visualizations. It can be useful if the spot colors are blocking the background image.
  • Minimum count value: Values from the selected continuous variable to plot at or below this threshold will not be displayed.
  • Gene color scale: Whether to use the color blind friendly palette (viridis) or to use a custom palette that we used for our paper. Other options from the viridisLite R package are also supported.
  • Gene color direction: whether colors should be ordered from darkest to lightest or in the reverse direction.

We will cover the download button and upload CSV options at the end of this document.

Clusters (static)

Displays the selected cluster variable (from discrete variable to plot) for the given sample (from samples to plot). You can also choose to see the background image and clusters side to side.

## Reproduce locally with
spatialLIBD::vis_clus()

Clusters (interactive)

Displays a 1,200 by 1,200 pixels interactive plot area with a matrix of 2 by 2 plots. The top row shows the data at the spot-level with the histology information in the background. The bottom row shows the spot-level data at a reduced dimension space (PCA, TSNE, UMAP). The left column shows the selected gene or continuous variable, while the right column shows the selected cluster or discrete variable. The four plots are linked to each other such that if you use the lasso selector (mouse over to the top right of the interactive area to select it) in a single plot, the other 3 will get updated to highlight the same selection of points.

This panel allows you to look at the results from a given clustering approach and combine that information with the expression of a given gene to visualize the spot-level data both in the spatial resolution as well as a reduced dimensionality space from the expression of the most variable genes.

Once you have selected spots of interest, at the bottom of the tab there is a text box where you can enter your manual annotations. This overwrites spe$ManualAnnotation which is why you need to confirm doing so by clicking the button Label selected points (from lasso) with manual annotation. You can then change the clusters to plot option to ManualAnnotation to see your new spot labels.

Given the amount of data being displayed, this tab consumes quite a bit of resources.

Note that there can be a maximum of 36 unique manual annotations (unique values in spe$ManualAnnotation) before we run out of colors to visualize them.

Clusters grid (static)

This tab is similar to clusters (static) with the difference being that you can visualize a subset or even all samples at once. Select the samples you want to visualize, then specify the grid on which they will be plotted (the number of rows and columns), and click the upgrade grid plot button. We ask that you use this button every time you want to update the plot as it can take a few seconds for this update to complete.

This particular tab is useful if you have computationally defined some clusters using the data of all your samples and you want to visualize the resulting clusters across multiple (or even all the) samples at the same time.

## Reproduce locally with
spatialLIBD::vis_grid_clus()

Gene (static)

This tab is similar to clusters (static) but instead of displaying discrete values (like clusters), it displays continuous values such as the gene expression of a given gene or the number of cells per spot. By default, spots whose value is below or at 0 are not shown, which makes it easier for you to distinguish points with low values from those below the threshold of your interest (controlled by minimum count value). The points can be colored in two different color scales. You can also choose to see the background image and continuous values side to side.

## Reproduce locally with
spatialLIBD::vis_gene()

Gene (interactive)

This tab shows a single interactive plot. It is similar to clusters (interactive) as in you can use the lasso selector (mouse over top right to find it) to select spots and them label them using the text box at the bottom with the corresponding button. Unlike clusters (interactive), this version includes checkboxes at the top for each of the unique values of the selected discrete variable to plot such that you can subset the spots to those present on a given cluster.

Note that if you have discrete variable to plot toggled to the ManualAnnotation option and update the spot-level information with the text box and button at the bottom of the tab, then it will re-load the interactive visualization and you will lose your selection of points.

Gene grid (static)

This is the equivalent of clusters grid (static) but for continuous variables, just like gene (static) was the equivalent of clusters (static).

## Reproduce locally with
spatialLIBD::vis_grid_gene()

Edit image

This panel shows you all the options we have for manipulating the colors and properties of the selected background image. These results will be available under the edited_image option in the image chooser menu. You can perform sequential manipulations of the image, though it will get hard to keep track of all the changes you made.

## Reproduce locally with
spatialLIBD::img_update_all()

Saving and uploading your spe$ManualAnnotation results

Beyond visualizing the data, the main goal of this section of spatialLIBD is to enable you to label spots. That is done only through the interactive tabs as previously described. Your manual annotations are saved under spe$ManualAnnotation and you can save them for future use using the main menu download button. If you click this button, it will prompt you to save a CSV file. We recommend that you keep selected the checkbox Drop NA layer entries in the CSV file? which means that your CSV file will be smaller and will potentially lead to less conflicts with other CSV files you make. That is, you will likely avoid re-labeling the same spot with different values in two or more of these CSV files. This is particularly useful if you plan to work on one sample at a time, save your results, and then merge them all into a single CSV file.

These CSV files with your manual annotations can be re-uploaded to spatialLIBD. You can notice this by choosing ManualAnnotation under clusters to plot and using any of the clusters tabs. If you upload more than one CSV, any values you have under spe$ManualAnnotation will be overwritten if the spot is present in your CSV file. Thus, if you followed the recommended workflow of saving one CSV file per sample, you can then upload them all sequentially and merge them together into a single CSV file to simplify your work later.

In summary, the order in which you re-upload the CSV files matters as newer uploads will overwrite any duplicated spots from previous CSV files.

We also recommend saving your work often in case you lose connection to spatialLIBD. Though you could always run this website locally by using the following command:

## Reproduce locally with
spatialLIBD::run_app()

This will require about 3GB of RAM to run on the server side, though potentially more, specially when using the clusters (interactive) tab.


Download PDF


This is a 2 by 2 plotting area with the top row showing the spatially-resolved data on top of the histology images. The bottom row shows the data on the reduced dimensions. The left column shows the selected continuous variable (typically a gene) while the right column shows the selected discreate variable (typically cluster annotations).

                  
                  Select points (lasso) to label them with a manual annotation.


Download PDF
Click the 'upgrade grid plot' button above to re-make this plot.


Download PDF


                  Select points to label them with a manual annotation.
                  Note that only spots passing the minimum count value will be updated.


Download PDF
Click the 'upgrade grid plot' button above to re-make this plot.


Edit the selected image by manipulating the colors and apperance, which can be useful when inspecting the selected image from the left menu ('image name'). Once you have a set of edits you like, click the 'update custom image' button below to save your edits. Next, select on the left menu ('image name') the 'edited_image' option to use your new image as the background image in the rest of the visualizations. Most of these image manipulations are explained at the magick R package documentation. If you want a uniform colored background, set the brightness to 0 which will make it black, then either proceeed or select the 'negate' checkbox for white, click the 'edit custom image' button, and select the input 'image name' as 'edited image'. Instead of using 'negate' you could use 'transparent (color)' and type 'black' then under 'background (color)' type a valid R color name such as 'purple' or 'lightblue' or a color HEX value such as '#e1eb34'.
Leave this empty if you don't want to select a channel. Note that the definition of channel here is different from a multi-channel image from say VisiumIF.
Modulate the colors in the image. Brightness and saturation are in percents while hue has a range of 0 to 200. Use 100 for all 3 options for no change.

Try with 1 to start with.
You could try 256 colors or a much small number like 25 or 40.

Type 'purple' and select a fuzz of 25 to start with.

Choose a small radius, like 1 or 2 to start. The higher the value, the longer this computation will take.
Reset all image editing menus to their default values.
Download PDF


Click the 'upgrade custom image' button above to save the custom image. You can then select 'edited_image' and use it in other parts of the web application. Note that if you had 'edited_image' already selected, you'll need to re-select or change another input to update the other plots.
Select if you want to do sequential image manipulations when you have selected as input the 'edited_image'.

Basic information overview about the layer-level SingleCellExperiment object (pseudo-bulked from the spot-level data). You can download it using spatialLIBD::fetch_data(type = "sce_layer").


                  When this information has been displayed it means that the shiny web application has finished loading and you can start exploring the rest of it.
                  

Layer-level spatialLIBD documentation

This document describes the layer-level portion of the shiny web application made by the spatialLIBD Bioconductor package. You can either find the documentation about this package through Bioconductor or at the spatialLIBD documentation website. Below we explain the options common across tabs and each of the tabs at the layer-level data. As explained in the documentation, the layer-level data is the result of pseudo-bulking the spot-level data to compress it, reduce sparsity and power more analyses.

Slides and videos

You might find the following slides useful for understanding the features from this part of the web application. Particularly slides 10-12 and 15-22.

These slides were part of our 2021-04-27 webinar for BioTuring that you can watch from their website or YouTube:

A recording of an earlier version of this talk is also available on YouTube.

You might also be interested in this video demonstration of spatialLIBD for the LIBD rstats club. Particularly starting at minute 26 with 25 seconds.

Raw summary

Before the documentation, this tab displays the SingleCellExperiment object that contains the layer-level data. It’s basically useful to know that the data has been loaded and that you can start navigating the app. If you wish to download this data, use the following command.

## Download sce data
sce_layer <- spatialLIBD::fetch_data(type = 'sce_layer')

Throughout the rest of this document, we’ll refer to this object by the name sce_layer.

This tab also shows the statistical modeling results, described below, that you can access locally and re-shape using the following code.

## Reproduce locally with
modeling_results <- fetch_data('modeling_results')
sig_genes <-
        spatialLIBD::sig_genes_extract_all(
            n = nrow(sce_layer),
            modeling_results = modeling_results,
            sce_layer = sce_layer
        )

Common options

  • Model results: the statistical modeling results to use. We computed three different types of models:
    1. enrichment: one layer against all the the other layers. Results in t-statistics.
    2. pairwise: one layer against another one. Results in t-statistics with two-sided p-values.
    3. anova: changes among the layers (adjusting for the mean expression) using the data from either all layers (full) or after dropping the white matter layer (noWM) since the rest of the layers have a richer concentration of neurons.

Reduced dim

In this panel you can visualize the layer-level data (sce_layer) across reduced dimensionality representations derived from the gene expression data from the layer-level pseudo-bulked data. Select which dimensionality reduction method to use with Reduced Dimension (PCA, TSNE, UMAP, etc) then Color by to choose which variable to color data by. The options are:

  • c_k20_k7, c_k7_k7 and c_k5_k7 which are shared nearest neighbors with either 20, 7 or 5 neighbors cut at 7 clusters.
  • kmeans_k7: k-means clustering results using k = 7 clusters
  • layer_guess, layer_guess_reordered, layer_guess_reordered_short and spatialLIBD are all based on our manual annotations which were used for pseudo-bulking the data.
  • sample information such as the subject (donor brain), replicate (whether it’s the first or second slide in a pair of spatial replicates), position (spatial replicate distance), subject_position (the six unique spatial replicate pairs), or sample_name which is the sample ID.
## Reproduce locally with
scater::plotReducedDim(sce_layer)

Model boxplots

This tab allows you to make a boxplot of the logcounts gene expression from the layer-level data (sce_layer) for a given gene; you can search your gene by typing either the symbol or the Ensembl gene ID. The model result information displayed in the title of the plot is based on which model results you selected and whether you are using the short title version or not (controlled by a checkbox). We provide two different color scales you can use: the color blind friendly viridis as well as a custom one we used for the paper. Through the Model test selector, you can choose which particular comparison to display. For example, Layer1 for the enrichment model means that you would display the results of comparing Layer1 against the rest of the layers. Layer1-Layer2 for the pairwise model means that you would display the results of Layer1 being greater than Layer2, while Layer2-Layer1 is the reverse scenario. Under pairwise, the layers not used are display in gray.

Below the plot you can find the subset of the table of results (sig_genes from earlier), sort the table by the different columns, and download it as a CSV if you want. For more details about what each of these columns mean, check the spatialLIBD vignette documentation.

## Reproduce locally with
spatialLIBD::layer_boxplot()

Gene Set Enrichment

This tab allows you to upload a CSV file that has a particular format as illustrated in this example file. This CSV file should contain:

  • one column per gene set of interest labeled as column names on the first row,
  • no row names,
  • and human Ensembl gene IDs as values in the cells.

Once you have uploaded a CSV file following this specific format, you can then check if the genes on each of your gene sets are enriched among the statistics from model results (enrichment, etc) that have a false discovery rate (FDR) adjusted p-value less than FDR cutoff (0.1 by default).

Similar to the Model boxplots tab, you can interact with the results table or download it.

## Reproduce locally with
spatialLIBD::gene_set_enrichment()
spatialLIBD::gene_set_enrichment_plot()

Spatial registration

If you have a single nucleus or single cell RNA-sequencing (snRNA-seq) (scRNA-seq) dataset, you might group your cells into clusters. Once you do, you could compress the data by pseudo-bulking (like we did to go from spe to sce_layer). You could then compute enrichment (pairwise, anova) statistics for your cell clusters. If you do so, you can then upload a specially formatted CSV file just like the one in this example file. This file has:

  • column names,
  • human Ensembl gene IDs as the row names (first column, no name for the column),
  • statistics (numeric values) for the cells.

Once you have uploaded a CSV file following this specific format, you can then assess whether the correlation between your statistics and the ones from our layers for the subset of genes (Ensembl ids) present in both. The resulting heatmap and interactive correlation matrix (which again you can interact with and download) can be useful if you are in the process of labeling your sn/scRNA-seq clusters or simply want to compare them against the layer-specific data we have provided.

Finally, you can change the Maximum correlation for visualization purposes on the heatmap as it will change the dynamic range for the colors.

## Reproduce locally with
spatialLIBD::layer_stat_cor()
spatialLIBD::layer_stat_cor_plot()
Select a reduced dimension name to visualize. These are pre-computed with the pseudo-bulk level data (layer-level for Maynard et al, Nature Neurosci, 2021).
Use a minimum value of 2. If you use the up arrow button, it is automatically restricted to the maximum range for the selected reduced dimension name. For values of 3 or larger, paired scatterplots will be shown.
Select a variable name to use for coloring the pseudo-bulked samples in the reduced dimensions plot.
This controls the text font size. For example, if you are visualizing 10 dimensions, consider using a theme size of 13.
This controls the point size. For example, if you are visualizing 10 dimensions, consider using a point size of 4.
Download PDF


Short label for the statistical test done. For the model type 'enrichment', 'model test' is the selected group against all other ones. For 'pairwise' it's 'G1-G2' where the t-statistics are G1 > G2. For 'anova', it's an F-statistic.
Select a gene to show. Only genes whose data is included are shown, so the set of genes is dependent on the 'model results' and 'model test' selected.
'viridis' are color-blind friendly colors (default). 'paper' are the ones used in Maynard et al, Nature Neurosci, 2021. 'bluered' are blue and red colors.
Type of gene expression values you would like to see. Typical options are 'counts' for raw counts and 'logcounts' for log normalized counts.
Select a smaller value if your group labels are too long. Default: 2.7.
Deselect if you want a longer title that includes the gene ID (typically ENSEMBL) and the t or F statistic value.

Download PDF


Selected model and gene across all tests

Download CSV This table shows the selected gene across all 'test's for the selected 'model type'. This information is useful if you want to quickly check the results for other 'test's under the same 'model type' context. Column specifications are the following ones. 'top' is the rank of the gene ordered by the given statistic for a given 'model type' and 'test' . 'model type' is either an 'anova' F-statistic (any group is different), a 'pairwise' t-statistic (group 1 > group 2), or an 'enrichment' t-statistic (selected group > all others). 'test' is the short name identifying the selected group. 'gene' is the gene symbol. 'stat' is the F or t-statistic depending on the 'model type'. 'pval' is the un-adjusted p-value and 'fdr' is the FDR-adjusted p-value. 'gene_index' is the row number for from the input SpatialExperiment object corresponding to this gene. 'ensembl' is the gene ENSEMBL ID.

Selected model and test across all genes

Download CSV This table shows the selected 'model type' and 'test' across all genes. This table is useful if you want to find how other genes rank under the same model type and test context. It can be useful to find genes to select.
It should be a CSV file without row names and similar to this example file.
FDR cutoff for the gene enrichment odd ratios. Odd ratios with a p-value below the FDR cutoff won't be colored in the resulting heatmap. Use 1 to show all. Default: 0.1.
For 'enrichment', switch to 'depletion'. For 'pairwise', reverse the direction.

Download PDF


Download CSV Column specifications are the following ones. 'OR' is the odds ratio for enrichment among the input genes for the given 'ID' set and the genes significantly associated with given 'test' and 'model type' combination. 'Pval' is the odds ratio un-adjusted p-value. ''model type' is either an 'anova' F-statistic (any group is different), a 'pairwise' t-statistic (group 1 > group 2), or an 'enrichment' t-statistic (selected group > all others). 'test' is the short name identifying the selected group. 'ID' is the user-chosen label for identifying a given gene set: the example data has 3 such sets. 'fdr_cut' is the FDR cutoff on the odd ratio p-values colored in the previous heatmap.
It should be a CSV file similar to this example file.
Use a smaller positive number to change the range of the color scale used. Use 1 if you want the color range to reflect the maximum range of correlation values. Default: 0.81.

Download PDF


Download CSV Correlation matrix that is visually illustrated with the previous plot.
Please get in touch with the spatialLIBD authors through the Bioconductor Support Website (using the spatialLIBD tag) or through GitHub. Remember to help others help you by including all the information required to reproduce the problem you noticed. Thank you!

The following information will be useful to them:


This shiny application was developed by the R/Bioconductor-powered Team Data Science group at the Lieber Institute for Brain Development and is hosted by LIBD. It is powered by the spatialLIBD R/Bioconductor package which you can find described in its documentation website and you can use to run locally this shiny application by running the command spatialLIBD::run_app().
If you tweet about this website, the data or the R package please use the #spatialLIBD hashtag. You can find previous tweets that way as shown here. Thank you!